


Project Overview
Project Objective
The Pizza Sales Analysis Dashboard project focuses on uncovering actionable insights from pizza sales data to support business growth. Using SQL Server for data extraction and transformation, Excel for initial preprocessing, and Power BI for interactive visualization, the project identifies key performance indicators (KPIs), top- and bottom-performing pizzas, and sales trends over time.The resulting dashboard empowers stakeholders to track sales performance, understand customer preferences, and make informed, data-driven decisions.
Problem Statement
The business needs to evaluate its sales performance by understanding the total revenue, average order size, pizza preferences, and sales trends. Visual insights are crucial for stakeholders to make data-driven decisions and identify growth opportunities.
KPIs & Metrics
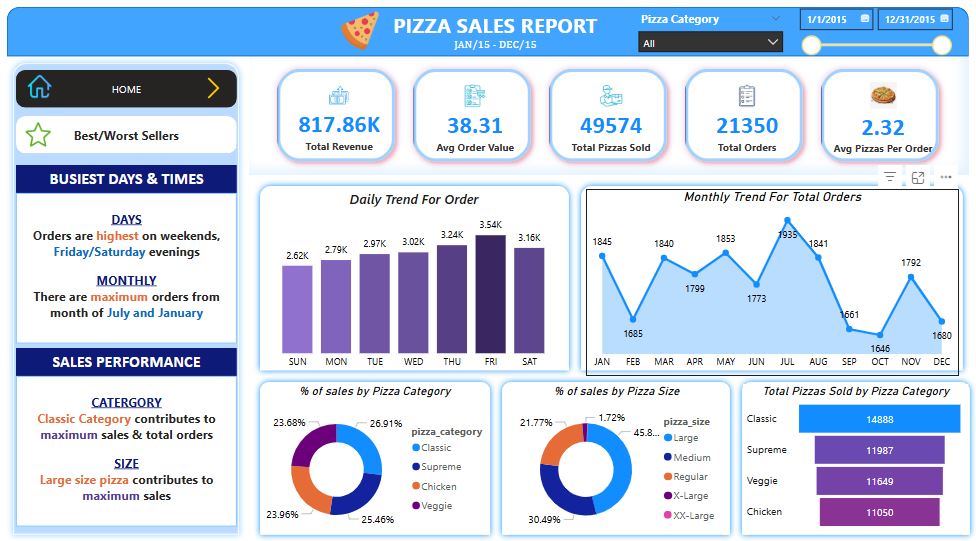
The following key metrics were calculated from the dataset:
- Total Revenue : Total income generated from all pizza orders.
- Average Order Value : Total revenue divided by the number of orders.
- Total Pizzas Sold : The total quantity of all pizzas sold.
- Total Orders : The number of unique customer orders.
- Average Pizzas per Order : Average number of pizzas per order (Total Pizzas Sold ÷ Total Orders).
Charts & Visualizations
The dashboard includes the following charts to provide clear visual insights:
• Daily Trend for Total Orders
Type: Bar Chart
Purpose: Identifies order volume trends over time.
• Hourly Trend for Total Orders
Type: Line Chart
Purpose: Shows peak order times during the day.
• Percentage of Sales by Pizza Category
Type: Pie Chart
Purpose: Highlights which pizza categories are most popular.
• Percentage of Sales by Pizza Size
Type: Pie Chart
Purpose: Visualizes customer preference for pizza sizes.
• Total Pizzas Sold by Pizza Category
Type: Funnel Chart
Purpose: Compares performance across pizza categories.
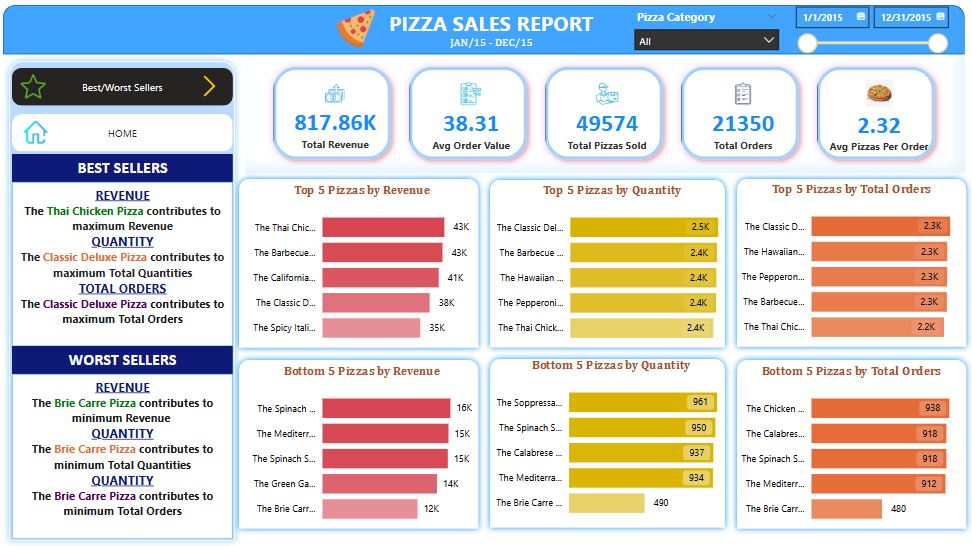
• Top 5 Best Sellers by Revenue, Quantity, and Orders
Type: Bar Chart
Purpose: Identifies most profitable and popular pizzas.
• Bottom 5 Worst Sellers by Revenue, Quantity, and Orders
Type: Bar Chart
Purpose: Identifies underperforming pizza products.
Data Processing Workflow
- Data Import & Cleaning: Raw data was cleaned using Excel and SQL. Missing values, duplicates, and incorrect entries were handled.
- SQL Queries: SQL scripts were written to calculate KPIs like revenue, order count, pizza sold, etc.
- Power BI Modeling: Data model relationships were built in Power BI using fact and dimension tables.
- Visualization: Interactive charts were created in Power BI to display trends, comparisons, and distributions.
Dashboard Insights
• Peak orders occur during specific lunch and dinner hours.
• Medium-sized pizzas are the most sold.
• Veg pizzas contribute significantly to the overall revenue.
• A few pizzas dominate the revenue and order counts.
• Some pizzas show consistently poor performance in all aspects (revenue, quantity, and orders).
Skills & Technologies